Table of Contents
1. Terms of use
This is a human-readable summary of and not a substitute for the License.
You are free to:
- Download and use the Licensed Material for non-commercial and commercial purposes
- Create, produce and reproduce Adapted Material
- Share the Licensed Material and/or the Adapted Material
Under the following terms:
- You may not sell the Licensed Material.
- You must give Northern Lights JV DA credit, and provide a link to these terms and conditions, as well as a copyright notice if applicable.
- You may not share Adapted Material under a license that prevents recipients from complying with these terms and conditions.
- You shall not use the Licensed Material in a manner that appears misleading nor present the Licensed Material in a distorted or incorrect manner.
This license is based on CC BY 4.0 license, two important changes are:
- The licensed material may not be sold
- The license covers all data in the dataset whether or not it is by law covered by copyright
2. Summary
This dataset contains the results of a rock mechanical testing program performed by NGI for Northern Lights JV DA on sandstone and shale from CCS exploration well 31/5-7 (Eos) in EL 001. Samples are from Cook sandstone (2680.25 -2680.5 m), Johansen 4 sandstone (2761.00 - 2761.25 m), Johansen 3 sandstone (2725 - 2725.25 m), and Intra-Drake shale (2592.00 – 2595.18 m) formations. Figure 1 shows examples of Cook formation sandstone and Drake formation shale samples, and a photo of the triaxial cells used for testing.
For each of the 3 sandstones, data from 3 triaxial tests, 1 hydrostatic test, 1 uniaxial stress test, and 3 Brazilian tests are presented. These tests allowed for the measurement of key mechanical properties of the sandstone.
For the shale, data from 4 permeability tests (2 on vertical plugs and 2 on horizontal plugs), 5 undrained triaxial tests (3 on vertical plugs and 2 on horizontal plugs), and Brazilian tests on vertical and horizontal plugs are presented.
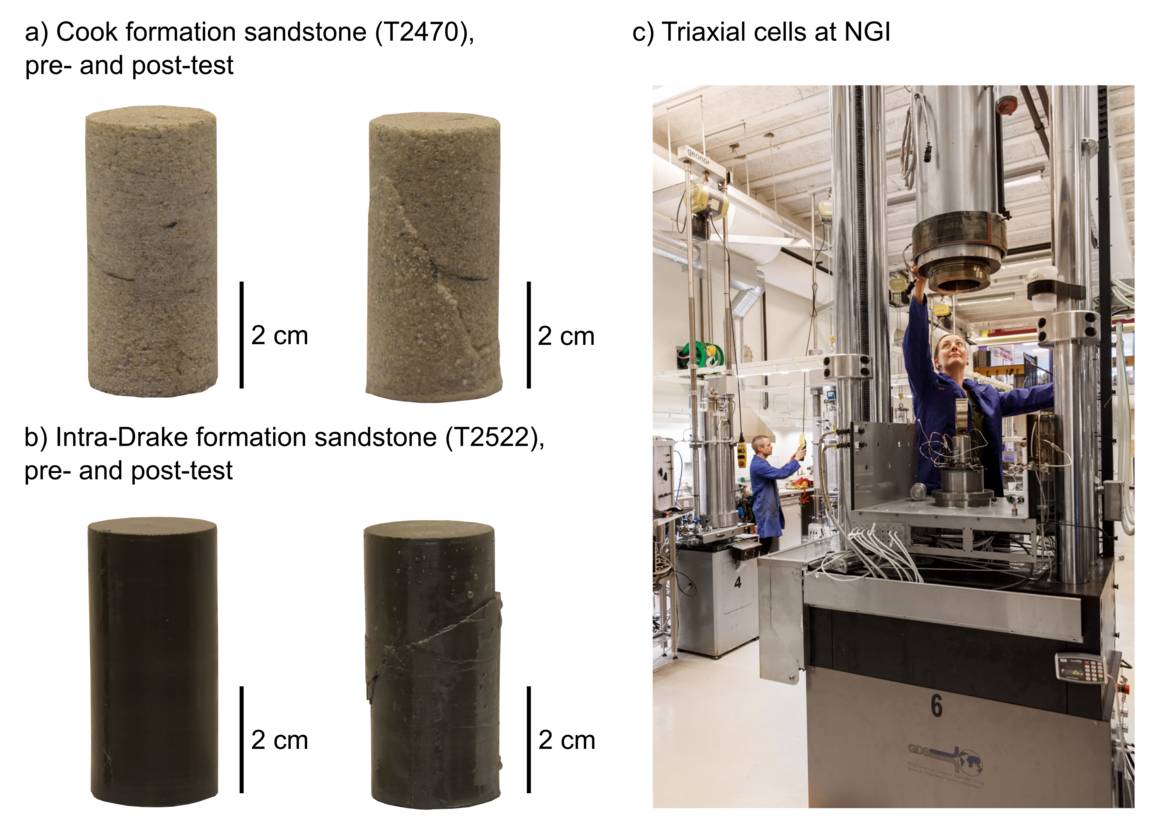
Figure 1: Examples of samples used for triaxial testing and test equipment.
The datasets are provided in the form of excel spreadsheets accompanied by PDF figures illustrating the data and containing photos of the samples. Details on the data format are described in Section 5.
An interpretation of this dataset relevant to reservoir characterisation and numerical modelling, including elastic moduli, mechanical and permeability anisotropy, and failure criteria, is provided in Griffiths et al. (2023).
3. Test procedures
This section describes the procedures and parameters chosen for the different tests. For a more general description of the triaxial test equipment and methods, see Berre (2011). Ultrasonic wave velocities are reported for all tests.
The pore fluid used for testing was distilled water with dissolved NaCL – 80 g/L for all sandstone tests, and 120 g/L for all shale tests.
3.1. Johansen and Cook sandstone formations
Brazilian tests
Brazilian tests are indirect tensile strength tests. A total of 9 tests were performed on plugs cored in the vertical orientation (3 from each seal peel).
Triaxial CID tests
Three CID (consolidated isotopically, drained) triaxial tests were performed on each of the three sandstone seal peels. Stress was increased/decreased at a rate of 3.6 MPa/hour and strain was increased/decreased at a rate of 3 mS/hr. The procedure for each CID test was as follows:
- Increase cell pressure to 1 MPa.
- Saturate sample with brine, without flushing out pore fluid originally present within the rock.
- Increase effective horizontal stress, σh', to 5, 10, or 15 MPa with drainage from the specimen.
- Increase backpressure to 1 MPa.
- Drained loading-unloading cycling:
- The loading-unloading cycles for the tests conducted at σh' = 5 MPa were strain-controlled to ensure that the sample deformation remained well within the elastic domain. Unloading began at a maximum strain of 2 mS (axial strain) before unloading back to 1 mS (axial strain) and reloading.
- For tests conducted at σh' = 10 and 15 MPa, the load-unload cycles were stress-controlled.
- For all tests, samples were then axially loaded to failure at a rate of 3 mS/hr, under drained conditions and maintaining a constant effective horizontal stress.
Sandstone uniaxial strain tests (CAUST)
The CAUST protocol was an adapted version of the Dudley et al. (2016) constant pore pressure uniaxial strain tests (UST) protocol. Both radial and axial wave velocity measurements were made throughout.
For consolidation, first the isotropic effective stress was increased to the in situ horizontal stress, and then the effective axial stress was increased to the in situ vertical stress (whilst maintaining a constant effective horizontal stress). This simplified consolidation approach, as opposed to using a constant stress ratio, was chosen to avoid uncertainty due to non-linearity in sample stiffness and minimises the influence of any damage to the sample from core retrieval (Dudley (2016)).
Three uniaxial strain tests (UST) were performed on the sandstones, one for each of the seal peels. The procedure was as follows:
- Increase cell pressure to 1 MPa.
- Saturate sample with brine (without flushing out pore fluid originally present within the rock).
- Increase effective isotropic stress to the minimum effective in-situ stress (σh' = 10.9 MPa for both Johansen seal peels, σh' = 10.6 MPa for Cook).
- Grain stiffness and bulk stiffness measurement (as per Dudley (2016)):
- Increase pore pressure and cell pressure simultaneously from 1 to 6 MPa to maintain constant effective stress for grain stiffness measurement.
- 2x Cycle cell pressure – decrease and increase by 5 MPa (for bulk stiffness measurement).
- 2x Cycle pore pressure – increase and decrease by 5 MPa (for bulk stiffness measurement).
- Increase effective axial stress to in-situ effective vertical stress (σv' = 26.6 MPa for Johansen, σv' = 25.8 MPa for Cook).
- UST test:
- Uniaxial strain unload/reload of σv' of 10 MPa for calculation of constrained modulus.
- Main uniaxial strain loading/unloading phase to maximum σv' of 70 MPa.
Hydrostatic tests
Three hydrostatic tests were conducted on samples from each of the sandstone seal peals. A higher rate of stress increase of 5 MPa/hr was used to optimise the test duration and allow for refilling of pumps during the main loading phase within working hours. The procedure for hydrostatic testing was as follows:
- Increase cell pressure to 1 MPa
- Saturate sample with brine (without flushing out pore fluid originally present within the rock).
- Increase effective isotropic stress to 18.75 MPa.
- Increase backpressure to 1 MPa
- Effective isotropic stress unload-loading cycle of 10 MPa.
- Effective isotropic stress loading to σh' = 59 MPa.
3.2. Intra-Drake formation
Brazilian tests
Brazilian tests are indirect tensile strength tests. A total of 7 tests were performed on plugs cored in both the horizontal (4) and vertical (3) orientation. Tests were performed using ASTM D3967-16.
Permeability
Four permeability tests were conducted using the constant head method. The pressure gradient along the specimen was adjusted to maintain a measurable and stable flow. To measure the permeability both along and normal to bedding, two plugs were drilled horizontally and two vertically. The measurement procedure was as follows:
- Increase cell pressure to 15 MPa.
- Saturate the specimen with brine.
- Simultaneously increase backpressure to 15 MPa and cell pressure to 30 MPa so that the final effective isotropic stress is 15 MPa.
- Apply a pore pressure gradient between the top and bottom of the
specimen:
- 1 MPa and 4 MPa for the horizontal plugs*.
- 8 MPa for the vertical plugs.
*For the horizontal plugs, several layer-parallel fractures were observed which may influence the test results.
Triaxial CIU tests
CIU tests are isotropically consolidated tests with an undrained shearing phase. A total of 5 CIU tests were performed on the Intra-Drake shale (3 on vertical plugs and 2 horizontal plugs) at room temperature and using brine as the testing fluid. The procedure of the CIU tests was as follows:
-
Mount the specimen in the triaxial cell and apply a vacuum of ~-0.1 MPa.
-
Fill the cell with oil and apply a cell pressure of 0.5 MPa.
-
Increase the cell pressure to the target value (5, 10, or 15 MPa).
-
Release the vacuum, allowing salt water to enter the filter disks (swelling was not observed in any of the tests).
-
Apply a back pressure (resulting in a pore pressure) of 30 MPa whilst increasing cell pressure to maintain constant effective stress.
-
Wait until the volumetric strain has sufficiently stabilised.
-
Close off the pore line tubing between the sample and the pore pressure pump (undrained conditions).
-
Increase the axial load on the sample so that the samples deforms at a constant axial strain rate of ~0.09 mS/hr until failure. The calculation of the shear rate is dependent on the permeability to avoid a significant pore pressure build-up.
For the CIU test on the vertically-cored plug consolidated at 10 MPa effective isotropic stress, an additional drained loading/unloading cycle was performed to determine the drained Young's modulus, Poisson's ratio, and shear modulus.
For the CIU test on the horizontally-cored plug with a consolidation stress of 15 MPa effective isotropic stress, the consolidation phase was stopped at 10 MPa effective isotropic stress to repeat the same cycling procedure as for the vertical plug.
Uniaxial strain tests (CAUST) and creep measurements
As for the sandstones, the CAUST (confined anisotropically uniaxial strain test) protocol for the shale was an adapted version of the Dudley et al. (2016) pore pressure depletion uniaxial strain tests (UST) protocol. The main difference with the Dudley et al. (2016) procedure was that, as for the sandstone CAUSTs, the consolidation stresses were met through first increasing the effective horizontal stress to the in situ minimum horizontal stress, before increasing the axial stress. Both radial and axial wave velocity (P-wave and S-wave) measurements were made throughout. The procedure of the CAUST tests was as follows:
- Increase cell pressure to 1 MPa.
- Saturate the sample with brine (without flushing out pore fluid originally present in the rock).
- Increase total isotropic stress to the minimum effective horizontal in-situ stress (σh' = 13.9 MPa).
- Apply a backpressure of 25 MPa whilst controlling cell pressure to maintain an effective isotropic stress of 13.9 MPa.
- Increase backpressure to 30 MPa at slower rate of 0.036 MPa/hr to perform a measurement of grain stiffness.*
- Increase the effective axial stress to the in-situ effective vertical stress (σv' = 24.5 MPa). The chosen rate of stress increase is low enough to keep shear stress below the expected in situ shear stress (5.3 MPa).
- UST pore pressure depletion from 30 to 10 MPa, controlling pore pressure to maintain a constant rate of strain of 0.036 MPa/hr (determined from the permeability measurement).
4. Included data
Each test has a test ID number (or T-number) and the below table provides an overview of the different tests, the type of tests, the pore fluids used, the sample formation, depth, and orientation, as well as the available data.
Table 1 Overview of different tests and associated information.
| Formation | Test-ID | Depth [m] | Test type | Brine salt content [g/L NaCl] | Orientation relative to core axis | Available files |
|---|---|---|---|---|---|---|
| Cook 2 | T2470 | 2680.25 | CID | 80 | Parallel | Time series data (Excel), photos, figures (PDF) |
| Cook 2 | T2472 | 2680.25 | CID | 80 | Parallel | Time series data (Excel), photos, figures (PDF) |
| Cook 2 | T2476 | 2680.25 | CID | 80 | Parallel | Time series data (Excel), photos, figures (PDF) |
| Cook 2 | T2482 | 2680.31 | Hydrostatic | 80 | Parallel | Time series data (Excel), photos, figures (PDF) |
| Cook 2 | T2511 | 2680.31 | CAUST | 80 | Parallel | Time series data (Excel), photos, figures (PDF) |
| Johansen 4 | T2466 | 2725 | CID | 80 | Parallel | Time series data (Excel), photos, figures (PDF) |
| Johansen 4 | T2467 | 2725 | CID | 80 | Parallel | Time series data (Excel), photos, figures (PDF) |
| Johansen 4 | T2469 | 2725 | CID | 80 | Parallel | Time series data (Excel), photos, figures (PDF) |
| Johansen 4 | T2480 | 2725.06 | Hydrostatic | 80 | Parallel | Time series data (Excel), photos, figures (PDF) |
| Johansen 4 | T2507 | 2725.06 | CAUST | 80 | Parallel | Time series data (Excel), photos, figures (PDF) |
| Johansen 2 | T2461 | 2761 | CID | 80 | Parallel | Time series data (Excel), photos, figures (PDF) |
| Johansen 2 | T2463 | 2761 | CID | 80 | Parallel | Time series data (Excel), photos, figures (PDF) |
| Johansen 2 | T2464 | 2761 | CID | 80 | Parallel | Time series data (Excel), photos, figures (PDF) |
| Johansen 2 | T2479 | 2761 | Hydrostatic | 80 | Parallel | Time series data (Excel), photos, figures (PDF) |
| Johansen 2 | T2505 | 2761.06 | CAUST | 80 | Parallel | Time series data (Excel), photos, figures (PDF) |
| Intra-Drake | T2492 | 2592.81 | CIU | 120 | Parallel | Time series data (Excel), photos, figures (PDF) |
| Intra-Drake | T2514 | 2592.65 | CIU | 120 | Parallel | Time series data (Excel), photos, figures (PDF) |
| Intra-Drake | T2522 | 2592.65 | CIU | 120 | Parallel | Time series data (Excel), photos, figures (PDF) |
| Intra-Drake | T2529 | 2592.75 | CIU | 120 | Perpendicular | Time series data (Excel), photos, figures (PDF) |
| Intra-Drake | T2533 | 2592.75 | CIU | 120 | Perpendicular | Time series data (Excel), photos, figures (PDF) |
| Intra-Drake | T2528 | 2592.47 | CAUST | 120 | Parallel | Time series data (Excel), photos, figures (PDF) |
4.1 Johansen and Cook sandstone formations
The following results are presented in figures for each of the drained triaxial tests (CID) on sandstone:
- Pre- and post-test photos of tested specimen
- A timeline showing P- and S- wave (where available) velocities (Vp and Vs) and vertical and horizontal effective stress (σv' and σh') vs. elapsed time
- Effective vertical stress (σv') vs. vertical and horizontal strain (εv and εh)
- Horizontal strain (εv and εh) vs. effective vertical stress (σv')
- Shear stress (τ) vs. vertical and horizontal strain (εv and εh)
- Shear stress (τ) vs. effective horizontal stress (σh')
The following results are presented in excel datasheets:
- Time series data with stress, strain, pressure, and wave velocities
- Stress, strain and porosity following consolidation and at failure
The following results are presented in figures for each of the hydrostatic tests on sandstone:
- Pre- and post-test photos of tested specimen
- P- and S- wave (where available) velocities (Vp and Vs) and vertical and horizontal effective stress (σv' and σh') vs. elapsed time
- Effective vertical stress (σv') vs. vertical and horizontal strain (εv and εh)
The following results are presented in excel datasheets:
- Time series data with stress, strain, pressure, and wave velocities
- Stress, strain and porosity following consolidation
The following results are presented in figures for each of the drained uniaxial strain (UST or K0) tests on sandstone:
- Pre- and post-test photos of tested specimen
- P- and S- wave (where available) velocities (Vp and Vs) and vertical and horizontal effective stress (σv' and σh') vs. elapsed time
- Effective vertical stress (σv') vs. vertical and horizontal strain (εv and εh)
- Shear stress (τ) vs. vertical and horizontal strain (εv and εh)
- Shear stress (τ) vs. effective horizontal stress (σh')
- K0 (σh'/ σV') vs. effective vertical stress (σv')
The following results are presented in Excel datasheets:
- Time series data with stress, strain, pressure, and wave velocities
- Stress, strain and porosity following consolidation
4.2 Intra-Drake shale
The following results are presented in figures for each of the undrained triaxial tests performed at room temperature (CIU):
- Pre- and post-test photos of tested specimen
- P- and S- wave (where available) velocities (Vp and Vs) and vertical and horizontal effective stress (σv' and σh') vs. elapsed time
- Effective vertical stress (σv') vs. vertical and horizontal strain (εv and εh)
- Shear stress (τ) vs. vertical and horizontal strain (εv and εh)
- Shear stress (τ) vs. effective horizontal stress (σh')
The following results are presented in Excel datasheets:
- Time series data with stress, strain, pressure, and wave velocities
- Stress, strain and porosity following consolidation and at failure
The following results are presented in figures for each of the drained uniaxial strain (CAUST or K0) test:
- Pre- and post-test photos of tested specimen
- Effective vertical stress (σv') vs. vertical and horizontal strain (εv and εh)
- Shear stress (τ) vs. vertical and horizontal strain (εv and εh)
- Shear stress (τ) vs. effective horizontal stress (σh')
- P- and S- wave (where available) velocities (Vp and Vs) and vertical and horizontal effective stress (σv' and σh') vs. elapsed time
- K0 (σh'/ σV') vs. effective vertical stress (σv')
The following results are presented in Excel datasheets:
- Time series data with stress, strain, pressure, and wave velocities
- Stress, strain and porosity following consolidation
The following results are presented in an Excel datasheet:
- Sample dimensions, orientation, water content and density
- Load at failure and inferred tensile strength
5. Data format
The data and graphs are split into two downloadable datasets.
5.1. Sample description and characterisation
In the Single input values sheet of the Excel spreadsheet for a test, sample information such as the material type, depth, unit weight etc. are reported. Also reported are the initial dimensions and porosity of the samples, as well as the stress, strain conditions at the consolidation stresses and at the peak stress / failure.
Results from the Brazilian tests on the sandstone and shale samples, as well as the permeability results for the Intra-Drake shale are provided in separate Excel sheets.
5.2. Triaxial test data
For each triaxial test, the parameters provided in Table 1 as time series.
Table 2 Parameters provided as time series data in the "Time series" tab of the Excel sheets for each triaxial test.
| Description | Symbol | Unit |
|---|---|---|
| Date of current | Date and time | y-m-d-h:sec |
| Elapsed Time | tmin | min |
| Tn Root time during consolidation | Root(tmin) | root min |
| Time during shearing | Timeshearing | min |
| Vertical strain | εv | mS |
| horizontal strain | εh | mS |
| Octhahedral strain | εvol | mS |
| Pore pressure change | u | MPa |
| Pore pressure change during shearing | Δushearing | MPa |
| Effective vertical stress | σv' | MPa |
| Effective horizontal stress | σh' | MPa |
| Shear Stress | τ | MPa |
| Mean stress | σmean | MPa |
| Mean octhahedral stress | σoct | MPa |
| horizontal strain1 | εh1 | mS |
| horizontal strain2 | εh2 | mS |
| Delta value for regression | - | |
| Delta Vertical strain | Δεv | Δε mS |
| Delta horizontal strain | Δεh | Δε mS |
| Delta vertical stress | Δσv | Δσ MPa |
| Delta horizontal stress | Δσh | Δσ MPa |
| Pressure wave velocity | vp | m/s |
| Shear wave velocity | vs | m/s |
5.3. Graphs
For each test, several PDF documents are provided showing figures of the different times series data and photos of the samples before and after testing (see Included data section for more details).
6. Acknowledgments
The tests were designed by Luke Griffiths, Lars Grande and Nicholas Thompson, and were performed by Halvard Smith. Samples were prepared by Bjørnar Slensvik. Elin Skurtveit provided technical expertise. Northern Lights JV provided the core samples.
7. Note on citation
The dataset is assigned a unique Digital Object Identifier (DOI), which should be used for citing purposes.
This dataset is further described in Griffiths et al. (2023).
8. References
Berre, T., Gutierrez, M., Høeg, K., Nagel, N., & Kristiansen, T. (1996, October). Laboratory testing of an overburden shale. In Proceedings of the 5th North Sea Chalk symposium, Reims, France.
Berre, T., Triaxial Testing of Soft Rocks. Geotechnical Testing Journal, 2011. 34(1): p. 61-75.
Dudley, J.W., Brignoli, M., Crawford, B.R., Ewy, R.T., Love, D.K., McLennan, J.D., Ramos, G.G., Shafer, J.L., Sharf-Aldin, M.H., Siebrits, E., Boyer, J., Chertov, M.A., 2016. ISRM Suggested Method for Uniaxial-Strain Compressibility Testing for Reservoir Geomechanics. Rock Mech Rock Eng 49, 4153–4178. https://doi.org/10.1007/s00603-016-1055-4
L. Griffiths, N. Thompson, H. Smith, L. Grande, E. Skurtveit (2023, June). Rock mechanical testing of core from Eos CCS validation well (2023). In Proceedings of TCCS 12, Trondheim, Norway.
Standard Test Method for Splitting Tensile Strength of Intact Rock Core Specimens, ASTM D3967-16.