Table of Contents
1 Illinois Basin - Decatur Project Dataset
1.1 Terms of Use
This is a human-readable summary of and not a substitute for the Illinois Basin - Decatur Project (IBDP) CO2 Injection Datasets License.
You are free to:
- Download and use the Licensed Material for non-commercial and commercial purposes
- Create, produce and reproduce Adapted Material
- Share the Licensed Material and/or the Adapted Material
Under the following terms:
- You may not sell the Licensed Material.
- You must give the Illinois Basin - Decatur Project and the US Department of Energy credit:
- Illinois State Geological Survey (ISGS), Illinois Basin - Decatur Project (IBDP) CO2 Injection Monitoring Data, April 30, 2021. Midwest Geological Sequestration Consortium (MGSC) Phase III Data Sets. DOE Cooperative Agreement No. DE-FC26-05NT42588.
- You must provide a link to these terms and conditions, include the digital object identified (DOI) assigned to the dataset as well as a copyright notice if applicable.
- You may not share Adapted Material under a license that prevents recipients from complying with these terms and conditions.
- You shall not use the Licensed Material in a manner that appears misleading nor present the Licensed Material in a distorted or incorrect manner.
This license is based on CC By 4.0 license, two important changes are:
- The licensed material may not be sold.
- The license covers all data in the dataset whether or not it is by law covered by copyright.
1.2 Summary
The Illinois Basin – Decatur Project (IBDP) successfully demonstrated the safe geologic storage of carbon dioxide (CO\(_2\)) at the near commercial-scale. Such demonstration projects are essential to gain understanding of the workflows and monitoring equipment needed to be able to geologically sequester CO\(_2\) at a commercial scale, and to gain public confidence in the technology. The IBDP was phase III of the project carried out by the Midwest Geological Sequestration Consortium (MGSC), one of seven USDOE NETL RCSPs that were formed to evaluate the safety and effectiveness of geological storage of CO\(_2\) as a mitigation tool to address global climate change.
Phases I and II related to characterizing the regional geology, identifying geologic units that could be used as storage reservoirs for CO\(_2\), and to identifying CO\(_2\) emitters (industrial sources). The aim of Phase III (IBDP) was to demonstrate safe and effective storage through injection of 1 million tonnes of CO\(_2\).
IBDP began in 2007. After extensive geological screening work throughout the central Illinois Basin, the Archer Daniels Midland (ADM) facility in Decatur, Illinois was selected by the MGSC as the source of CO\(_2\) and the storage site of the IBDP. ADM operates an agricultural industrial facility with several product processing plants in Decatur, Illinois. The corn processing plant at ADM generates CO\(_2\) as a byproduct of the production of fuel ethanol. The storage complex at Decatur includes the Mt. Simon Sandstone, the lower third of which contains fluvial deposits with excellent reservoir quality. The Mt. Simon is overlain by low permeability shales and mudstones of the Eu Claire Formation that serve as a caprock/seal for the Mt. Simon reservoir. The IBDP site and the ADM facility are shown in Figure 1.
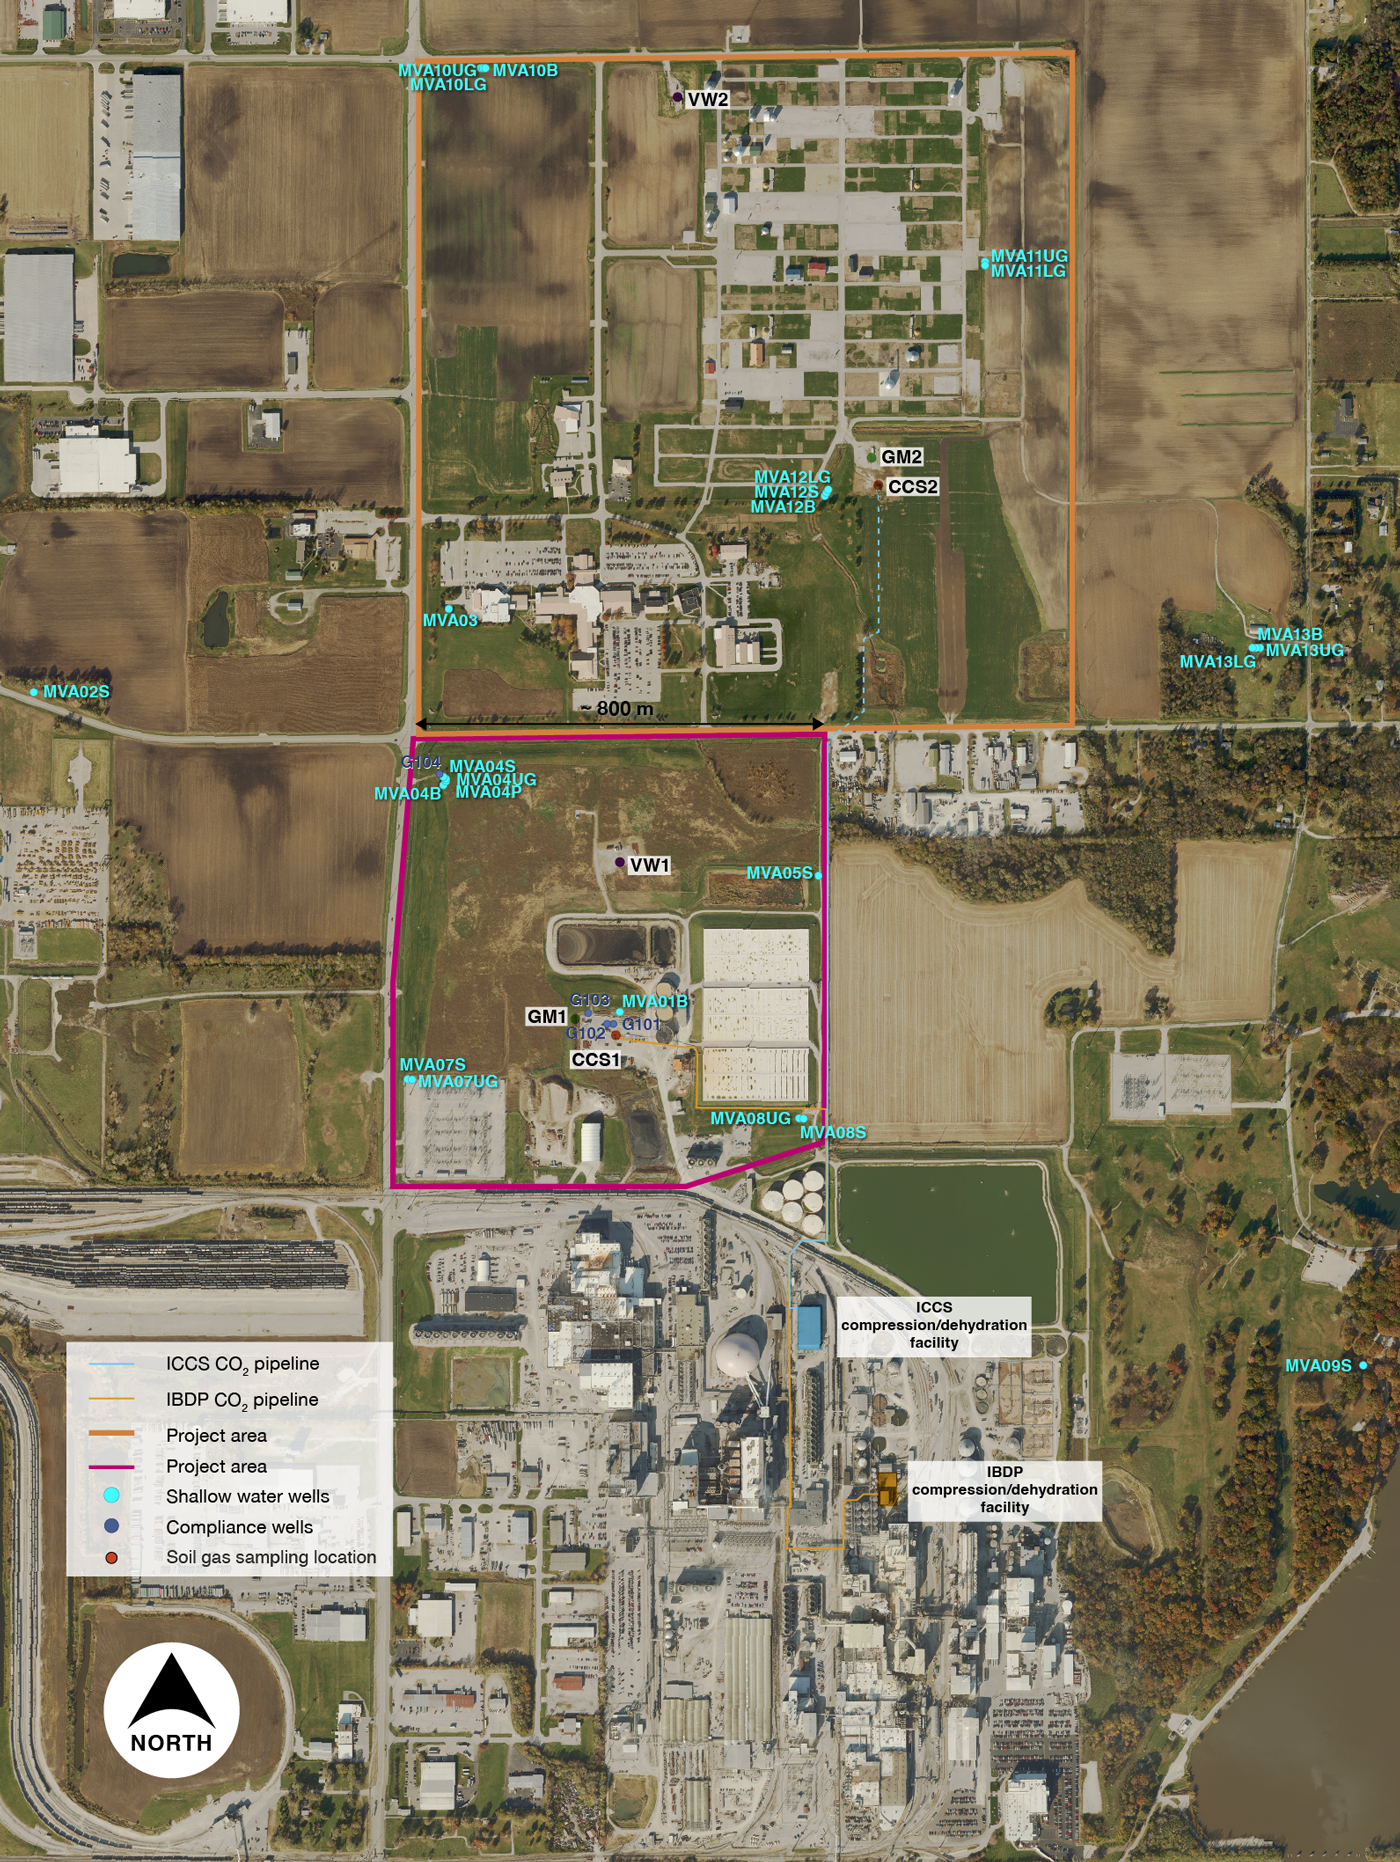
Figure 1: IBDP site and ADM facility (click on image for full resolution)
This dataset contains information from the IBDP Phase III project workflow from pre-injection site characterization, through injection and monitoring, to post-injection. The pre-injection period (2007- 2011) included additional regional characterization, site characterization, design, permitting, site infrastructure development, and baseline monitoring and modeling. Outreach and education also began in 2007 and continued throughout the life of the project. The injection period included CO\(_2\) capture, transport, and injection, and injection monitoring and modeling. The final period of the project (post-injection, 2014 –2021) included post-injection monitoring and modeling, and project closeout. It is important to note that certain activities that benefited IBDP, such as the Illinois Environmental Protection Agency (IEPA) Class I permit, 2D seismic and regional characterization, were started in Phase II.
Infrastructure installed for this project (Figure 1) includes three deep wells (injection (CCS1), monitoring (VW1), geophysical (GM1)), 17 shallow groundwater monitoring wells, microseismic monitoring with downhole 4-component sensors in the injection well, an in-well geophysical monitoring array for repeat plume monitoring using vertical seismic profile (VSP) methods, a compression/dehydration facility, and a 6,234 ft (1.9-km) pipeline.
During the 3-year injection period, wet CO\(_2\) at atmospheric pressure was collected from ethanol fermentation units at the ADM facility and delivered to the reservoir as dry supercritical CO\(_2\). The injection phase was safely and successfully completed in November 2014 with 999,215 tonnes of CO\(_2\) injected at a rate of approximately 1,000 tonnes/day into the lower Mt. Simon Sandstone at a depth of 6,890 feet (ft) (2,100 meters (m)).
Operational injection started on November 17, 2011, and was completed in November 2014. The objectives of the project were to validate the capacity, injectivity, and containment of the Mt. Simon Sandstone, which represents the primary CO\(_2\) storage resource in the Illinois Basin and the Midwest Region.
MGSC has undertaken an extensive monitoring, verification, and accounting (MVA) program for the IBDP that involves environmental measurements, monitoring, and computer modeling focused on the 0.25 mi2 (0.65 km2) site throughout the life of the project. Near-surface and subsurface monitoring are integral efforts to reach MVA and project goals, including: (1) establishing pre-injection environmental conditions to evaluate potential impacts from CO\(_2\) injection, (2) demonstrating that project activities are protective of human health and the environment, and (3) quantifying and tracking CO\(_2\) stored in the Mt. Simon during and after injection operations.
Research monitoring was initiated in 2009, allowing up to 24 months of pre-injection baseline data, and was concluded in 2020 after a 6-year post-injection period. The IBDP site is also being used to develop and field test CO\(_2\) storage-related MVA instrumentation and technology for deployment at future CCS projects in the United States and throughout the world. The MVA program is a coordinated effort among the Illinois State Geological Survey (ISGS), Schlumberger Carbon Services, ADM, Lawrence Berkeley National Laboratory (LBNL), University of Illinois, TRE-Canada and the Carbon Capture Project, Physical Sciences Incorporated, Illinois Department of Transportation, and others.
1.3 Included data
1.3.1 GIS and Georeferenced Imagery
Contains data from selected locations from the Illinois Basin - Decatur Project Near-Surface Monitoring, Verification, and Accounting Program.
These data are intended to provide a GIS-based portrayal and spatial archival of the IBDP project wells and the distribution of near-surface monitoring and sampling installations that were present at the IBDP field site. Note that these represent the locations of features/installations only, and that detailed sample/measurement data and interpretations are to be found in IBDP reports corresponding to specific sampling techniques or goals. Note that due to the short duration of some of the monitoring activities and/or per the IBDP MVA site decommissioning plan, portions of these installations may no longer be present on the IBDP site grounds.
Monitoring of the near-surface environment includes color aerial imagery, interferometric synthetic aperture radar (InSAR), shallow groundwater quality, soil CO\(_2\) fluxes, net exchange CO\(_2\) fluxes, and vadose zone CO\(_2\) concentrations. To aid this monitoring effort, a GIS basemap and file geodatabase was constructed to manage all well location and near-surface monitoring, verification, and accounting (MVA) installations at the project site at the Archer Daniels Midland ethanol plant in Decatur, IL. The geodatabase contains the point locations of deep project wells, shallow groundwater monitoring wells, and the locations of selected air and ground sampling points, monitoring installations, and a subset of base layer aerial imagery.
IBDP project imagery was acquired at two resolutions: high-resolution (LOW altitude flight) for site-specific work, and moderately resolution (HIGH altitude flight) for wide-area work; images are labeled by either LOW or HIGH altitude flight, respectively, below.
In general, twice-yearly imagery was acquired from project initiation through 2017 by the IL Dept. of Transportation (IDOT), Aerial Surveys Division, as an IBDP project partner; Post-2017 imagery was acquired yearly by Merrick & Company (Merrick), in 2018 and 2019. A representative sampling of Pre- through Post-Injection images from four different time stamps is listed below. The latter part of the image filename incorporates the original processed-image filename. Images are provided in the File Geodatabase; separate GeoTIFF format imagery also includes optional files for .tfw world file and associated ArcGIS information. All images are in the UTM16_NAD83 projection.
1.3.2 Horizons and Faults
The dataset contains the following horizons and faults exported from the Petrel model in .ts (GoCad) format.
| Horizons |
|---|
| Eau_Claire |
| Eau_Claire_Lime_Base |
| Eau_Claire_Shale |
| Mt_Simon_A-lower |
| Mt_Simon_A-upper |
| Mt_Simon_B |
| Mt_Simon_C |
| Mt_Simon_D |
| Argenta |
| PreCambrian |
| Z_Model_Base |
1.3.3 Reports
Various technical reports are included in the Reports section of the dataset. These include:
Geomechanical_reports:including a report on 3D finite element modeling for microseismic events, a report on in situ stress measurements and geomechanical analysis of cores from wells VW2 and GM2.Site_Maps-Images:images and maps showing a plan view of the site with well locations and the location of microseismic events.Static_Model_Report:report about the development of the static Petrel model and history matching of the corresponding dynamic model.Stratigraphy:Various stratigraphic diagrams and information including well logs, a stratigraphic column and notes from a core workshop about the Mt. Simon Sandstone.Well_Completion_Reports:Well completion report from verification well 2 describing lithology, bedding orientation, fracture orientation, principle stress direction.Well_Diagrams:Well diagrams and well completion reports for various wells.- Well testing reports
- The final report from the project dated July 2021.
1.3.4 Seismic
IBDP_3D_Seismic_Volume_Reprocessed
The high-resolution 3D seismic survey acquired in January 2015 was reprocessed in August 2019 to improve the resolution needed to identify and mapped faults in the subsurface. The processing workflow and results are described in
isgs-Inversion.pdf. Parameters for loading the seismic volume and viewing the data are provided in the filedecatur3d-loadsheet.xlsx. The 3D seismic reflection final processed volumes provided in the dataset are: PSTM depth volume, PSTM phase-shifted volume, Acoustic impedance volume, and porosity volume.IBDP_3D_VSP_Reprocessed
Time Lapse VSPs were acquired to provide information on CO\(_2\) plume development. Six 3D VSP surveys were acquired at the IBDP site: two baseline surveys and four monitoring surveys. The VSP data was reprocessed in 2019. One high-resolution image was created by combining the Baseline 2 and Monitor 1 surveys. Processing workflow and results are described in the file
2019-08-26_ISGS_Decature3DVSP_update.pdf. The dataset contains the time volume and depth volume along with geometry files for the two volumes.IBDP_Passive_Seismic_Events_Monitoring
Passive seismic monitoring was employed at the IBDP site to evaluate the use of microseismicity for monitoring and determine if conclusions could be developed relating to injection management. Microseismicity was monitored using two geophone levels installed in CCS1 as well as the permanent geophone array in GM1. Additionally a network of five surface seismometers were installed in 2013. See section 4.5.4 in
IBDP_Report_Final_07_July_2021_rev1.pdffor more information.
Figure 2: In ground equipment location for the IBDP. Figure 2. from
IBDP_20130106_PreInjection_Microseismic_Report.pdf
1.3.5 Selected Reports
Selected reports are available in the dataset and can be found in the following sub-folders.
- External Publications
Various external reports and publications.
ADM CCS1 Injection Well Mechanical Integrity Report March 2019 Pulsed Neutron eXtremeGreenhouse gas Laser Imaging Tomography Experiment (GreenLITE) Final Technical ReportInSAR Analysis of Ground Movement over the Decatur CO$_2$ Injection SiteRisk Management Status Illinois Basin – Decatur ProjectSpatial mapping of greenhouse gases using laser absorption spectrometers at local scales of interest
- ISGS Circulars in EDX
A reference list of Illinois State Geological Survey Circulars available in EDX.
- Outreach Materials
Various outreach materials for a general audience including fliers, brochures and fact sheets.
- Topical Reports
Various topical reports related to the IBDP.
Final Report of TDLAS CO2 Sensor Field Testing at the Illinois Basin – Decatur ProjectDesign, Startup, and Operation of a 50 MWe CO$_2$ Sequestration SystemSeismic Reflection Data Interpretation of the Proposed Illinois Basin-Decatur Carbon Sequestration SiteRisk Management Topical Report: Illinois Basin - Decatur ProjectCarbon Dioxide Capture and Transportation Options in the Illinois BasinAssess Carbon Dioxide Capture Options for Illinois Basin Carbon Dioxide ServicesCO2 Injectivity, Storage Capacity, Plume Size, and Reservoir and Seal Integrity of the Ordovician St. Peter Sandstone and the Cambrian Potosi Formation in the Illinois BasinDrilling, Completion, and Data Collection PlansSite Development, Operations, and Closure PlanSite Characterization, Modeling, and Monitoring PlansAn Evaluation of the Carbon Sequestration Potential of theCambro-Ordovician Strata of the Illinois and Michigan BasinsKnox Project: Wellbore Management and Geomechanical inputMonitoring CO2 injection for carbon capture and storage using time-lapse 3D VSPs
1.3.6 Static model
A Petrel geomodel is provided with the dataset. This is based on several seismic surveys taken at the site and well data from wells CCS1, VW1, VW2 and CCS2. A full description of how the static model was created can be found in Section 4 of the report "April_11_2019_IBDP_Petrel_Static_Model_Report.pdf".
| Seismic Survey | Description |
|---|---|
| 2010 Seismic Survey | Pre-injection baseline and site characterization survey. |
| 2011 Seismic Survey | Pre-injection baseline and site characterization survey. |
| (including 2010 Seismic Survey area with extension to north and northeast). | |
| Previous versions of the geomodel based on seismic interpretations from merged data sets of 2010 and 2011 seismic surveys. | |
| 2011 Seismic Survey Reprocessed | Reprocessed version of the 2011 seismic survey. |
| Processed simultaneously with 2015 seismic survey to preserve time-lapse signature integrity. | |
| Horizon interpretations from 2015 survey were used in 2016 version. | |
| 2011 Porosity Cube | 3D representation of porosity in the depth domain, which was the product of a post-stack seismic inversion, completed on 2010 and 2011 seismic surveys merged datasets. |
| 2011 Baseline Vertical Seismic Profile (VSP) | Baseline VSP survey acquired in 2011 for time-lapse monitoring of the CO2 plume development during several phases of injection. |
| Used to calibrate 3D seismic processing and to identify interbed multiples within the 3D surface seismic surveys. | |
| Used to validate horizon interpretation completed for the 2011 Seismic Survey Reprocessed. | |
| 2015 Seismic Survey | Post injection time-lapse survey designed to measure subtle differences between earlier surveys at and below the injection zone (may potentially represent the CO2 plume extent in the subsurface). |
| This survey had 0.41 miles (400m) of data collected to the north (intended to establish a new baseline for the ICCS project). | |
| 2011 and 2015 survey footprints were not identical (3) (differences were addressed and compensated for during processing). |
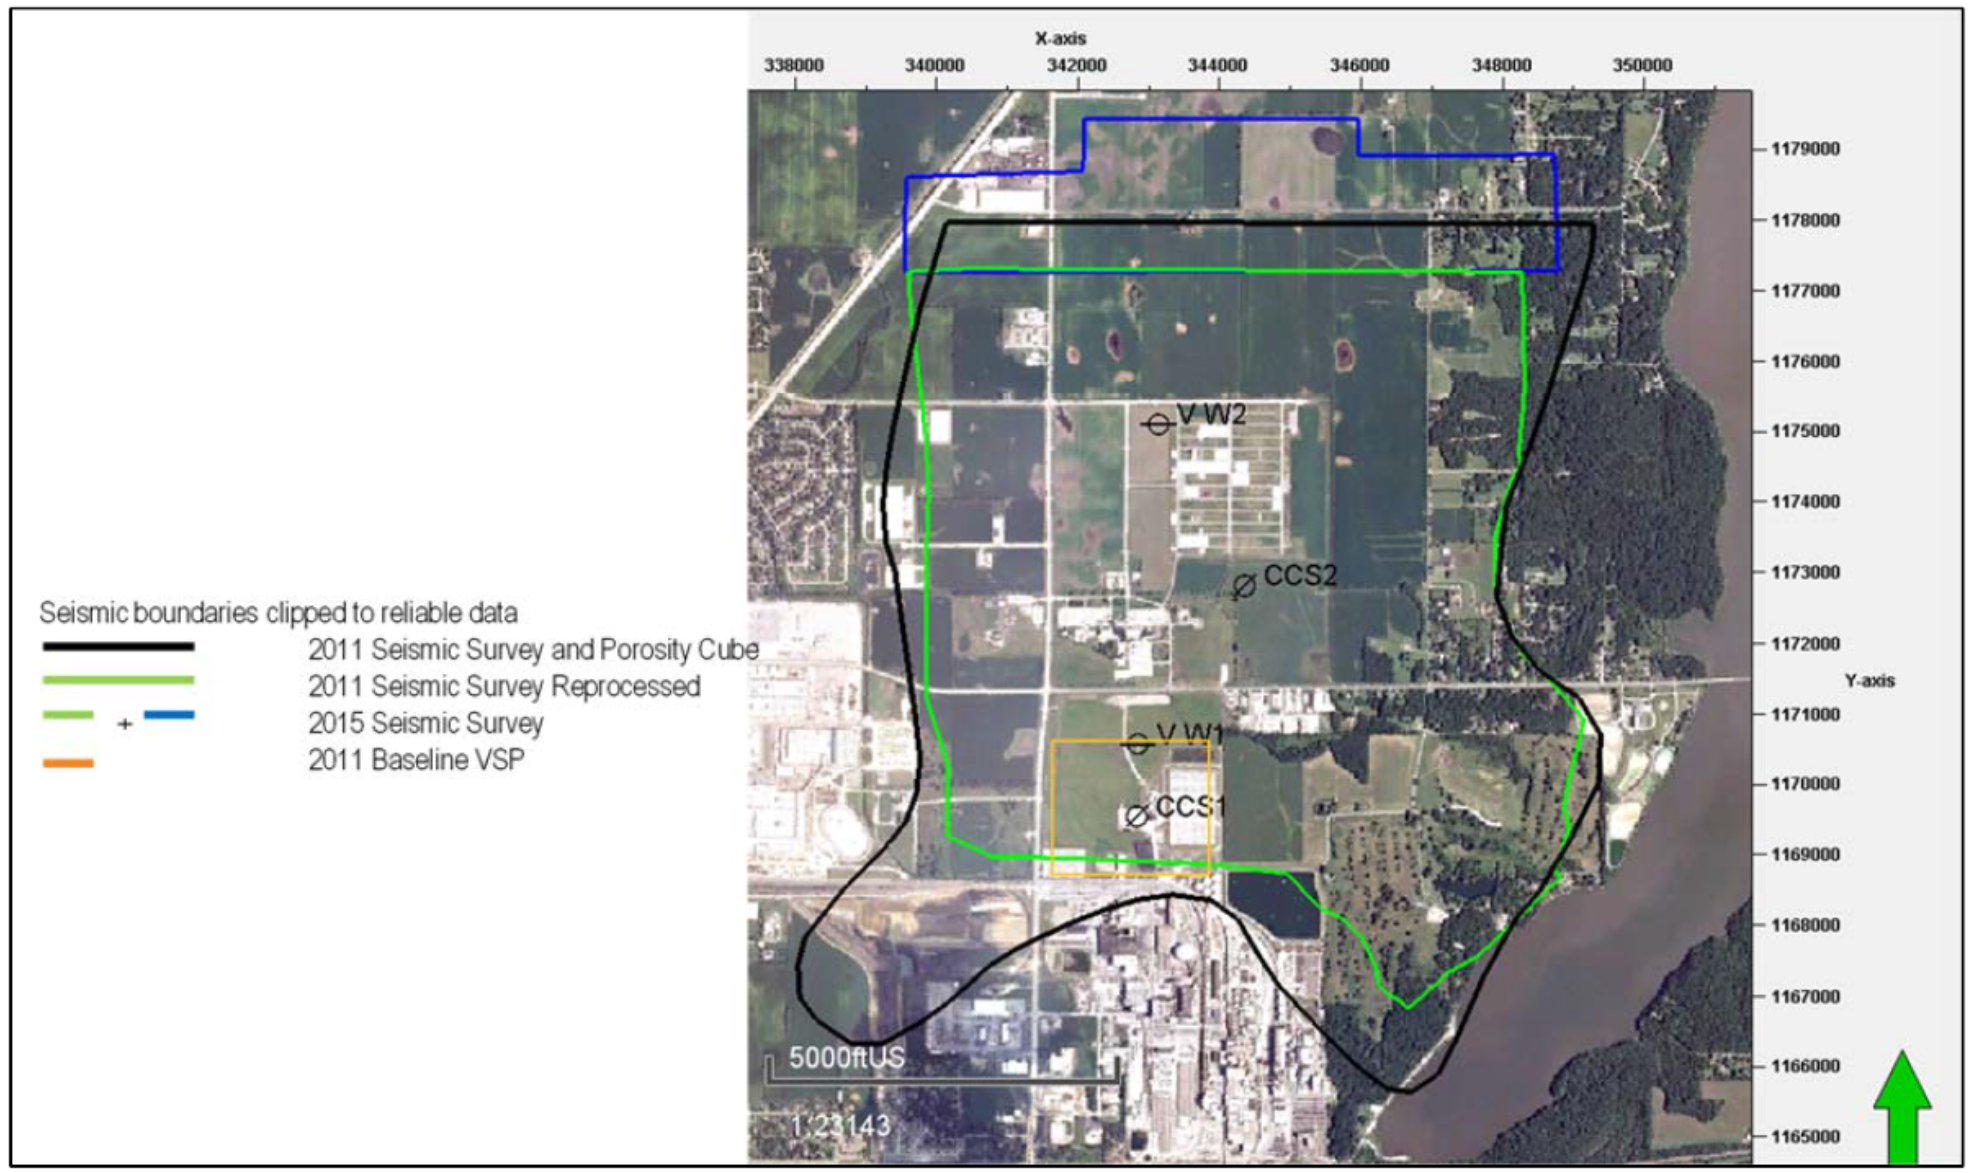
Figure 3: Map of seismic survey footprints from "April_11_2019_IBDP_Petrel_Static_Model_Report.pdf"
Well data from wells CCS1, VW1, VW2 and CCS2 were used for the following:
- Formation tops – to understand the formation structure
- Well logs – to understand the petrophysical properties of each formation
- FMI fullbore formation microimager logs – to understand sedimentary bedding planes, fractures and associated facies.
- Core plug analysis – to calibrate the petrophysical analysis.
- Elemental Log Analysis– to determine lithology fractions and, when combined with core analysis, estimate porosity and permeability.
More details about how the model was created from the seismic and well data can be found in Section 4.2 of the report "April_11_2019_IBDP_Petrel_Static_Model_Report.pdf".
- Grid
The extent of the grid is 15 x 15 miles with horizontal cell sizes of 150 ft. x 150 ft. and vertical cell sizes of 3 ft. It contains the following formations:
Formation (Zone) Number of layers Eau Claire 5 Eau Claire Lime Base 8 Eau Claire Shale 10 Mt. Simon 10 Mt. Simon D 10 Mt. Simon C 12 Mt. Simon B 20 Mt. Simon A-Upper 28 Mt. Simon A-Ips 3 Mt. Simon A-Lower 18 Argenta 15 Precambrian 25 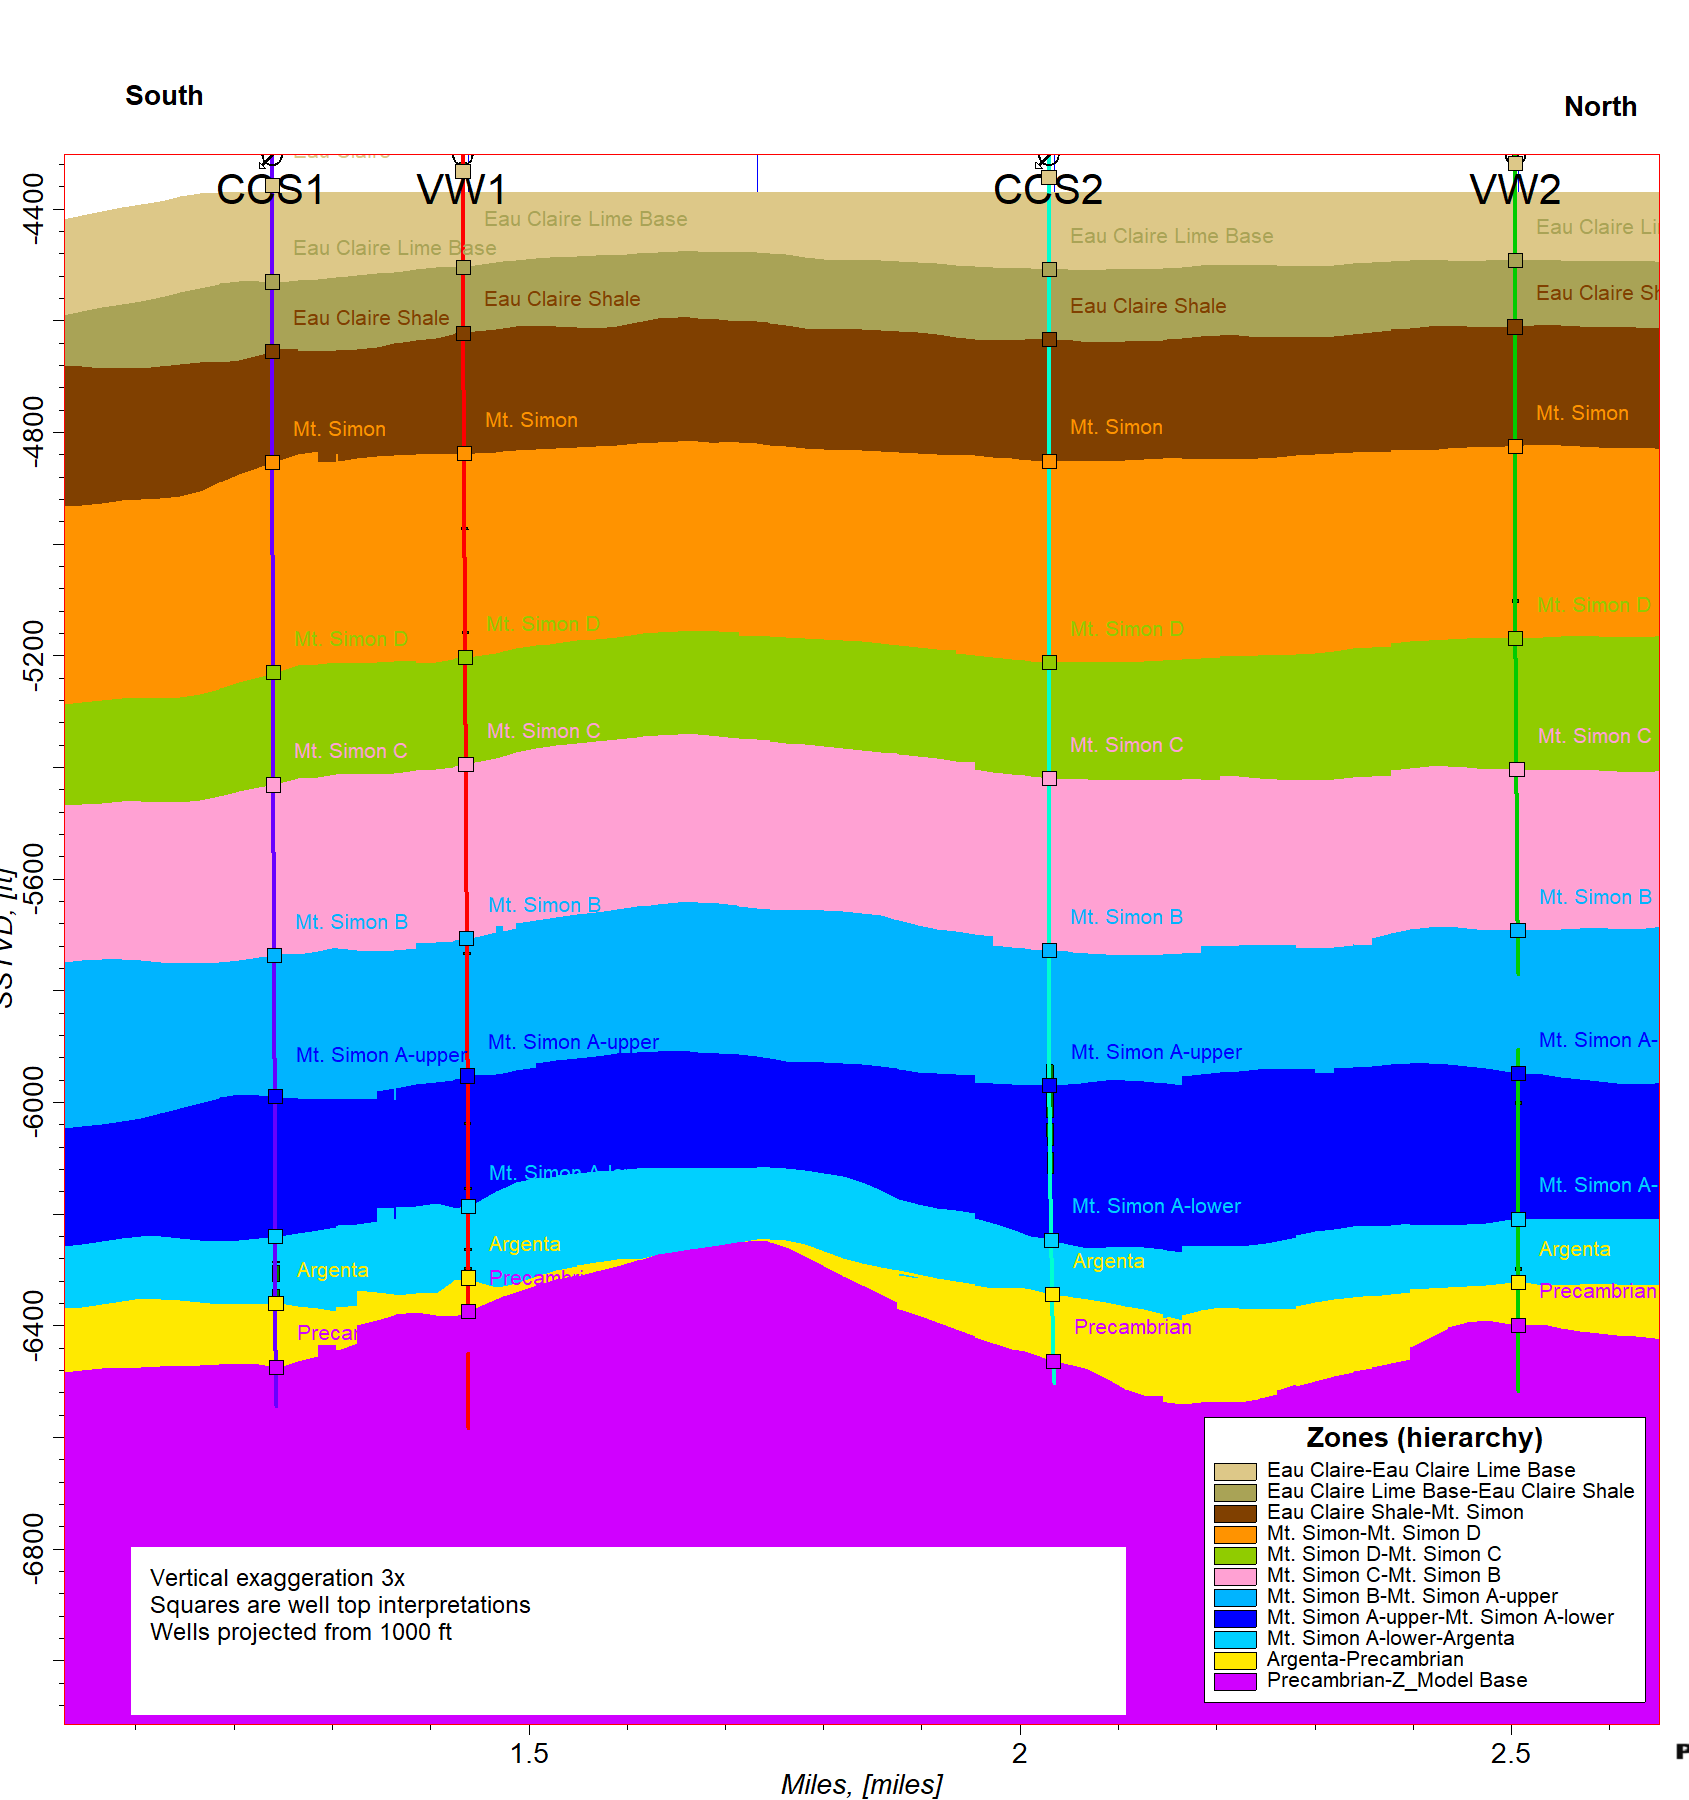
Figure 4: Cross section of the static model showing model zones, with wells projected onto it.
There are four faults present in the model.
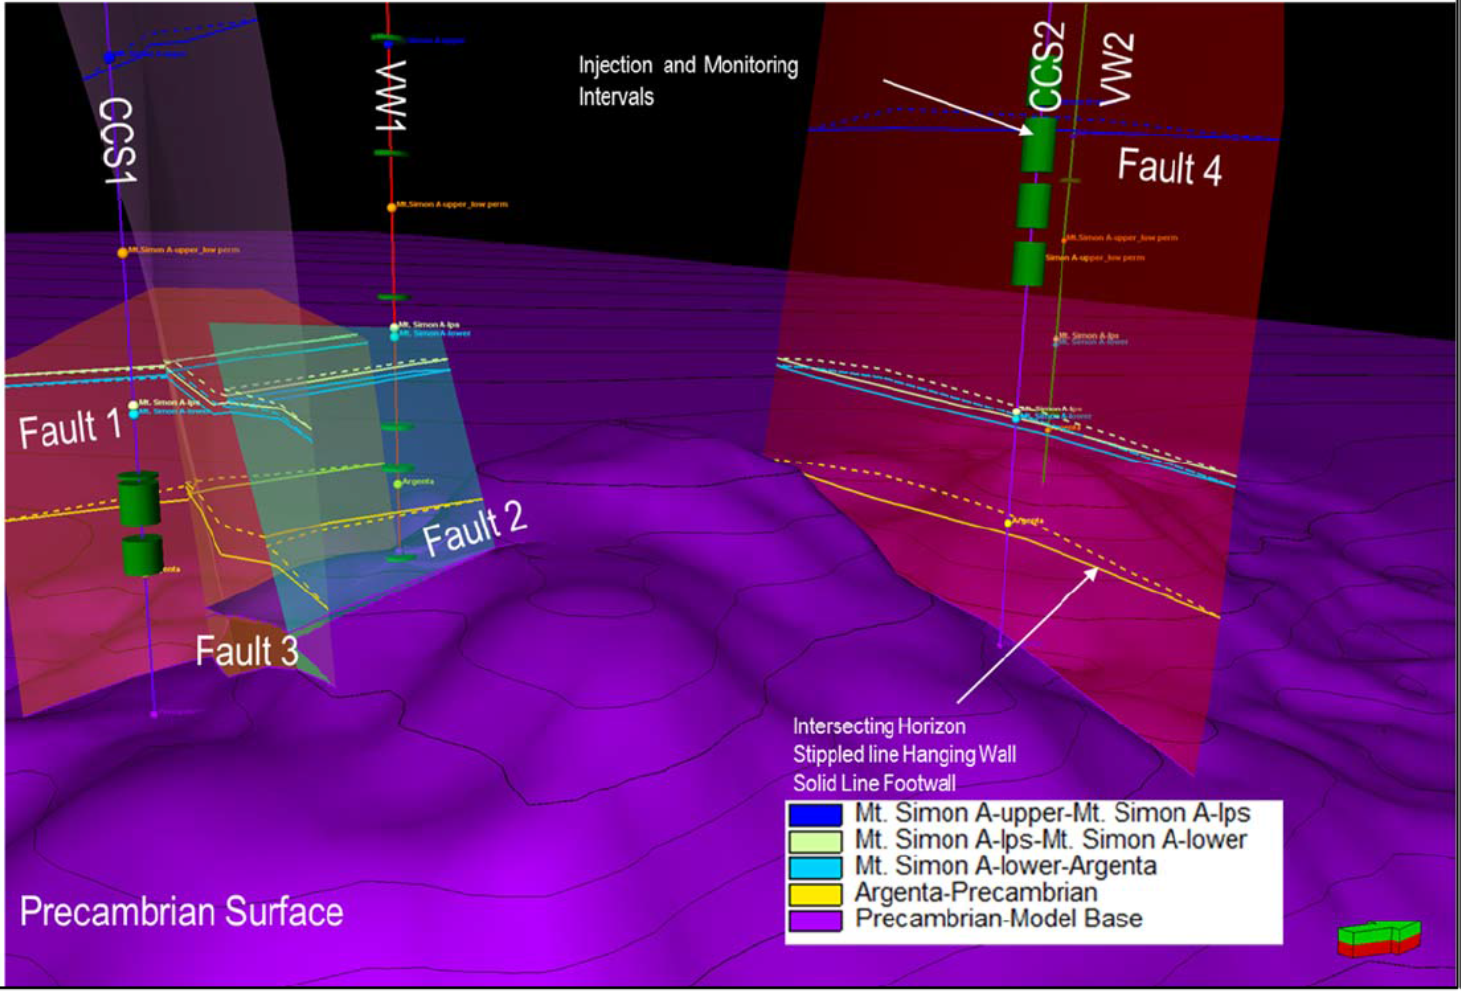
Figure 5: Faults present in the static model.
- Petrophysical property modeling
The following steps were used to carry out modeling of the petrophysical properties:
- Baffle Facies Modeling: Low porosity and permeability baffles were added to the model to divide the model into reservoir from non-reservoir facies.
- Upscale Facies, Effective Porosity and Permeability: Baffle facies, effective porosity and permeability logs from all four wells were upscaled into the grid.
- Relationships between Porosity and Acoustic Impedance (AI): Because there was an observed correlation between AI and Porosity the 2011 Porosity Cube was used as a co-kriging variable in petrophysical modeling.
- Variogram Analysis: A high resolution mini-grid was generated so the 2011 Porosity Cube could be upscaled into it. Geostatistics were extracted from the 2011 Porosity Cube Property for use in upcoming petrophysical modeling.
- Porosity Cube Extrapolation: The geostatistics from the mini-grid variogram analysis were used to populate the upscaled 2011 Porosity Property outside the seismic survey footprint.
- Facies, Effective Porosity and Permeability Interpolation: Using geostatistics from the variogram analysis, Gaussian Random Function Simulation (GRFS) was used to interpolate the baffle facies, effective porosity cokriged to the 2011 porosity property. Using geostatistics from the variogram analysis, GRFS was used to interpolate permeability co-kriged to effective porosity.
- Quality Control: Effective porosity and permeability properties were cross plotted to ensure a reasonable relationship.
More detailed information about the process can be found in Section 4.3 of the report "
April_11_2019_IBDP_Petrel_Static_Model_Report.pdf". - Logs
Logs available in the Petrel model are shown in Figure 6.
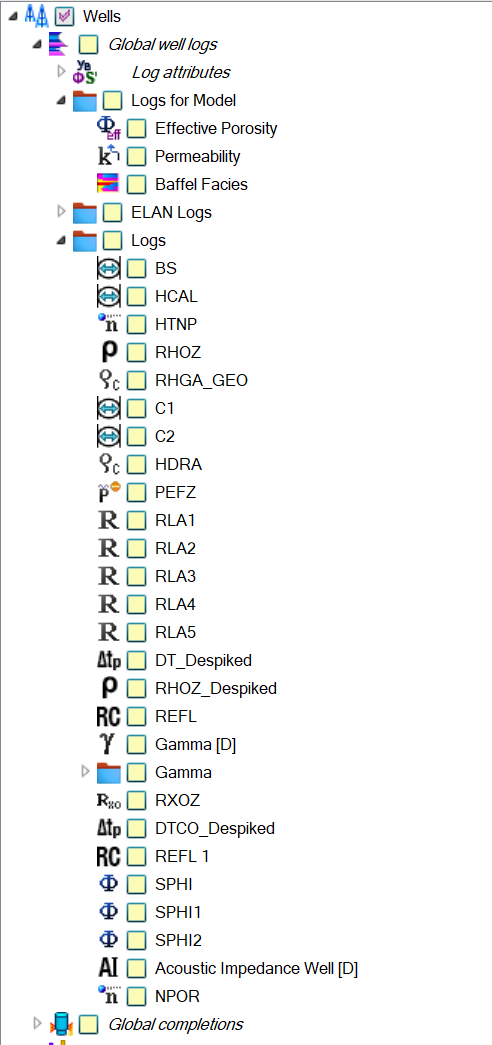
Figure 6: Logs in the Petrel model
1.3.7 Well Information
During the IBDP project, there were three deep wells drilled and data was collected from each:
- CCS1 (API 1211523415) was the CO\(_2\) injection well perforated in the lower Mt Simon.
- VW1 (API 1211523460) was an observation well monitoring multiple zones in the Mt Simon reservoir and above the Eau Clair seal.
- GM1 (API 1211523438) was a geophone well with multiple geophones stacked in the wellbore to monitor for microseismic activity and provide data during 3D seismic and vertical seismic profiling (VSP) events.
Data collected among the three wells included geophysical logs, core and sidewall core analysis, and various well tests, found in their respective sub-folders. See file IBDP_Glossary.xlsx for a listing of common well/sample-related terms/acronyms and their definitions. See folder Geology for an ASCII file of stratigraphic tops picked from the project wells, and representative geologic cross sections. See also folder Well_Design for well summary sheets and directional surveys.
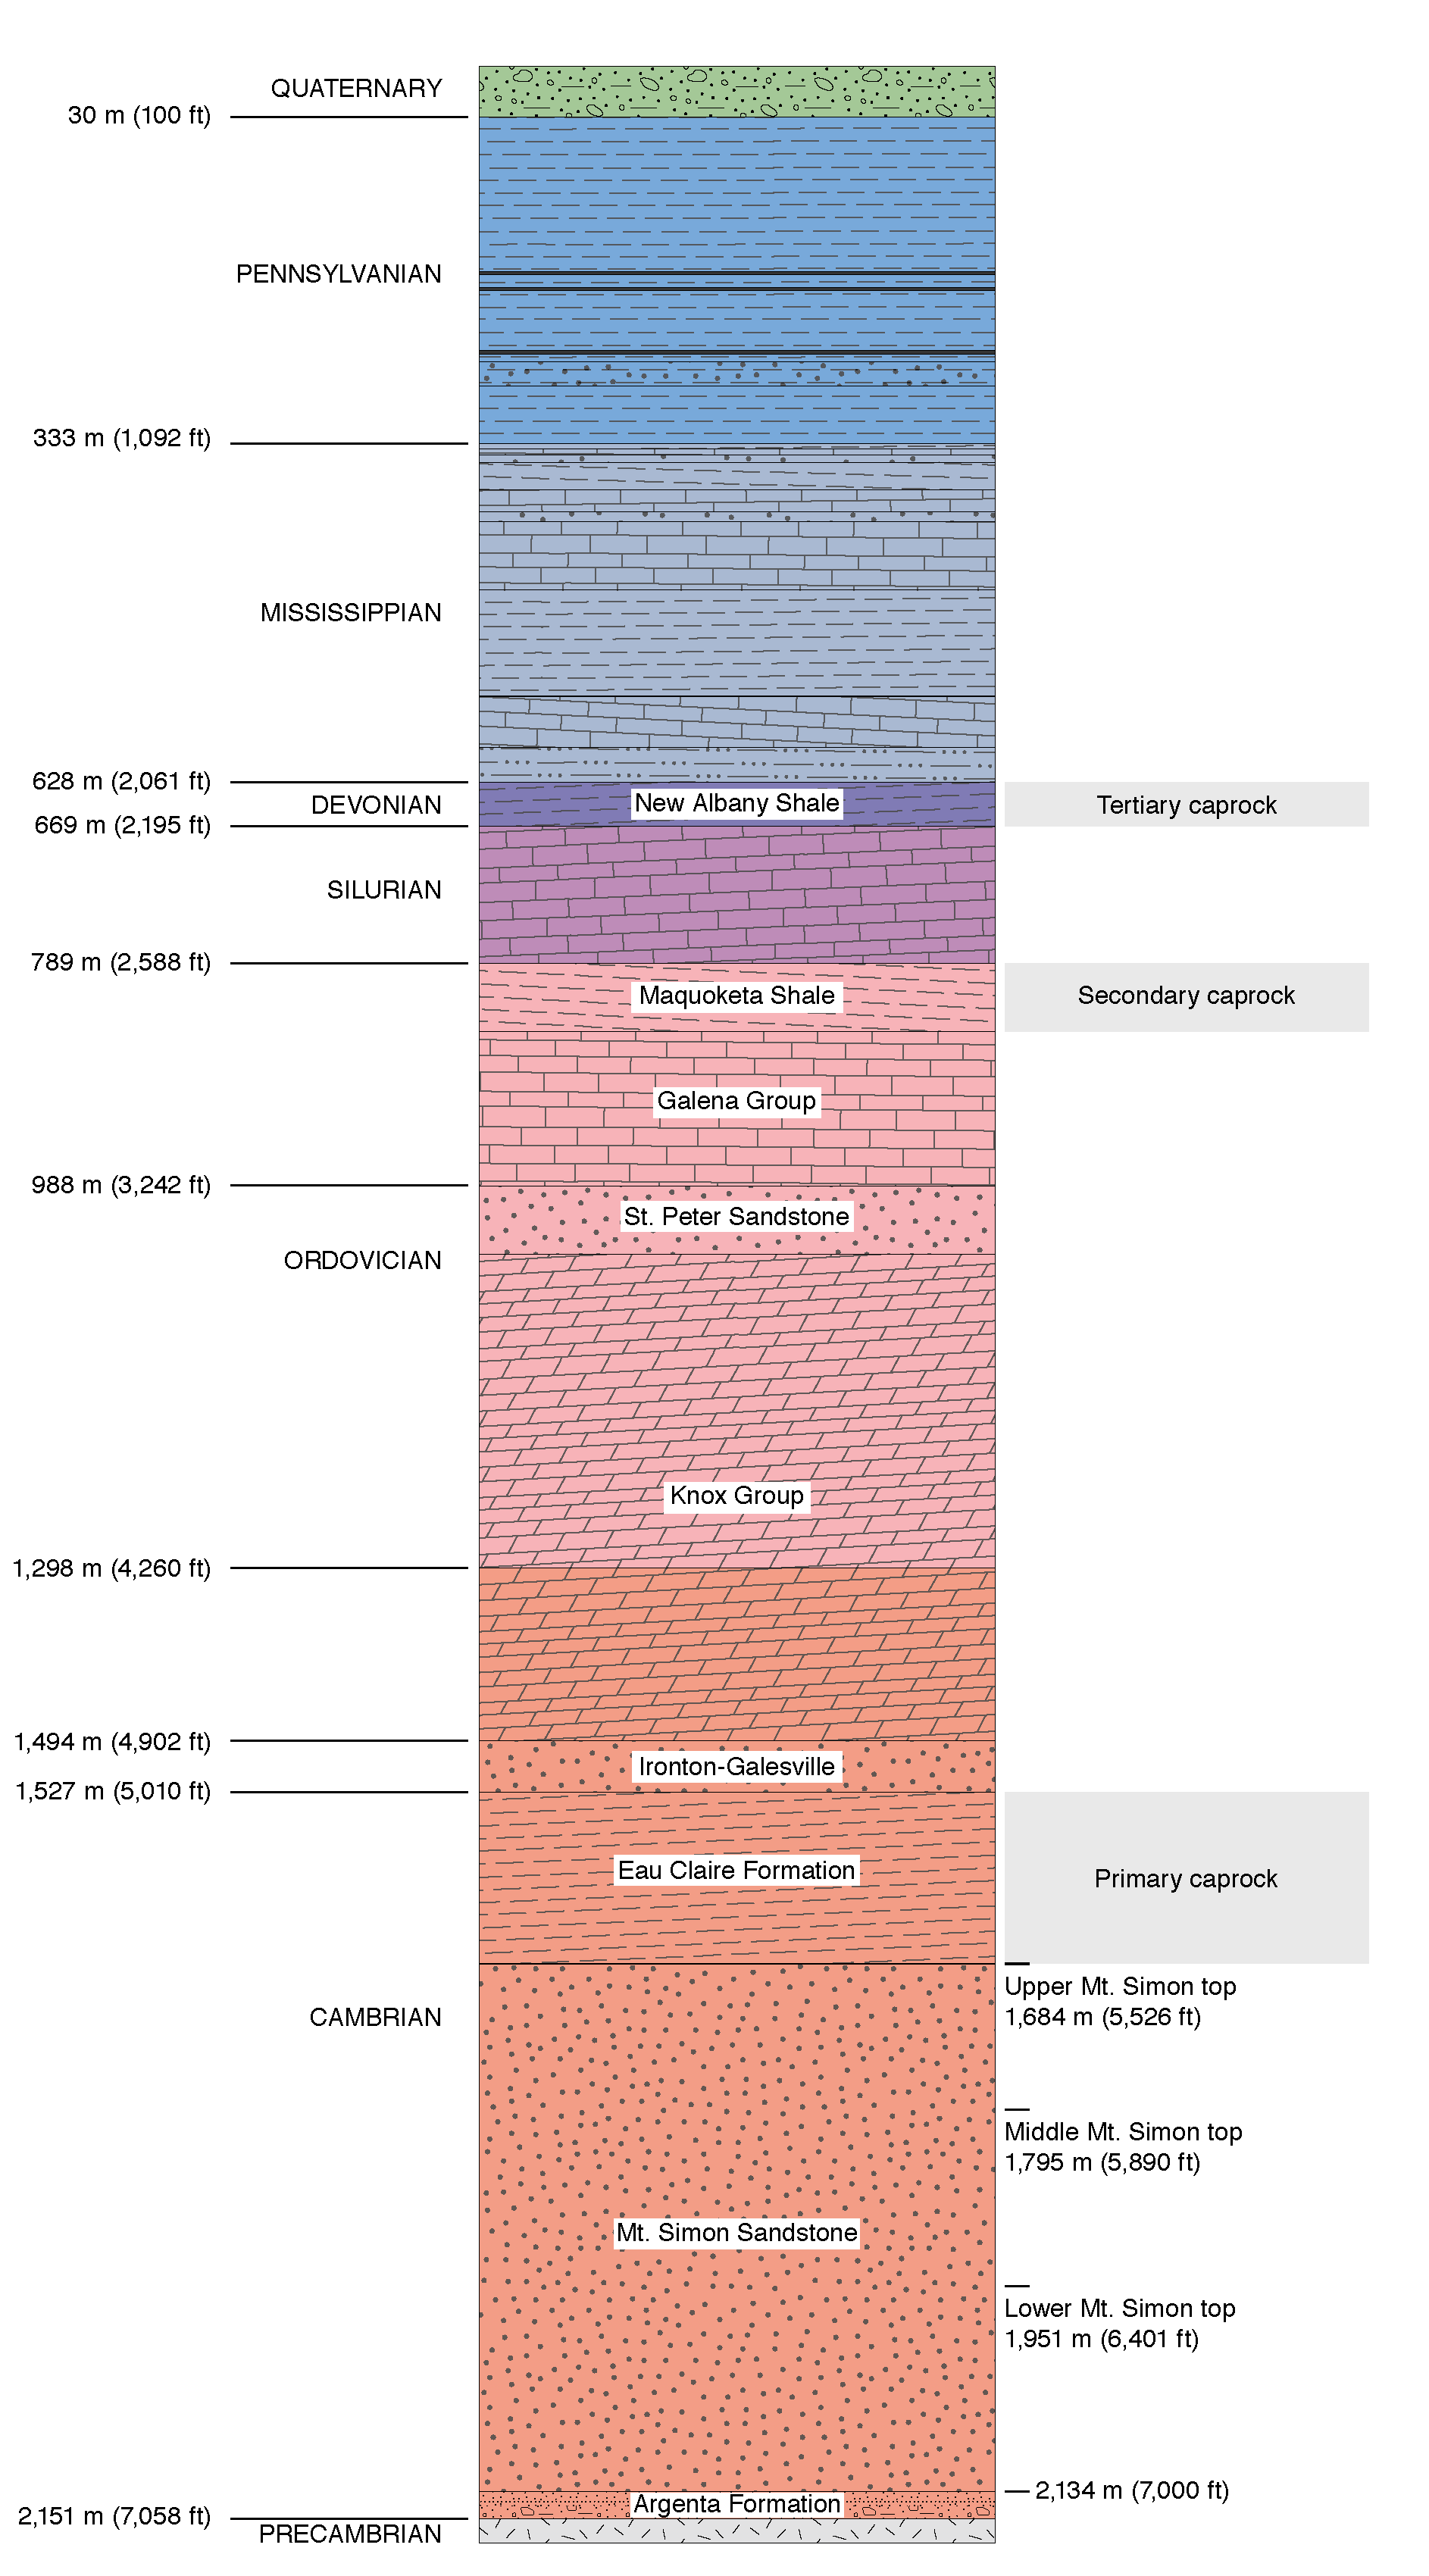
Figure 7: Generalized stratigraphic column
1.3.8 Seismic Event Catalog
The events in the catalog were recorded after the start of injection on 17 November 2011 until 2 July 2018 (2 years and 5 months after CCS1 injection ended). The data contains all events by data or occurence, located events by data of occurence, plots of event distributions, trigger change information, sensor information and event azimuth relative to CCS1. The data also contains source parameters.